Ask questions. Get charts. Step inside your data.
XR Data Explorer is a conversational data assistant for official statistics and your own datasets. Ask in plain Danish or English — by voice or text — and explore the answers as interactive 2D, 3D and VR charts, straight from your browser.
From question to chart in one conversation
No query language, no downloads, no spreadsheet gymnastics. The assistant finds the data, shapes it and charts it while you talk.
Talk to your data
Ask by voice or text, in Danish or English. The assistant searches, fetches and plots data through natural conversation.
Official statistics built in
Live connections to Danmarks Statistik, Statistics Sweden (SCB) and Alpha Vantage financial market data. Search tables, inspect variables and chart results without leaving the conversation.
Transform data by instruction
Filter, clean, calculate, aggregate, join and rank by asking. Every step is recorded, with full history and undo.
Chart recommendations you can trust
Chart type and axes are chosen deterministically from the statistics of your data — consistent and explainable, not guesswork.
Charts that stay live
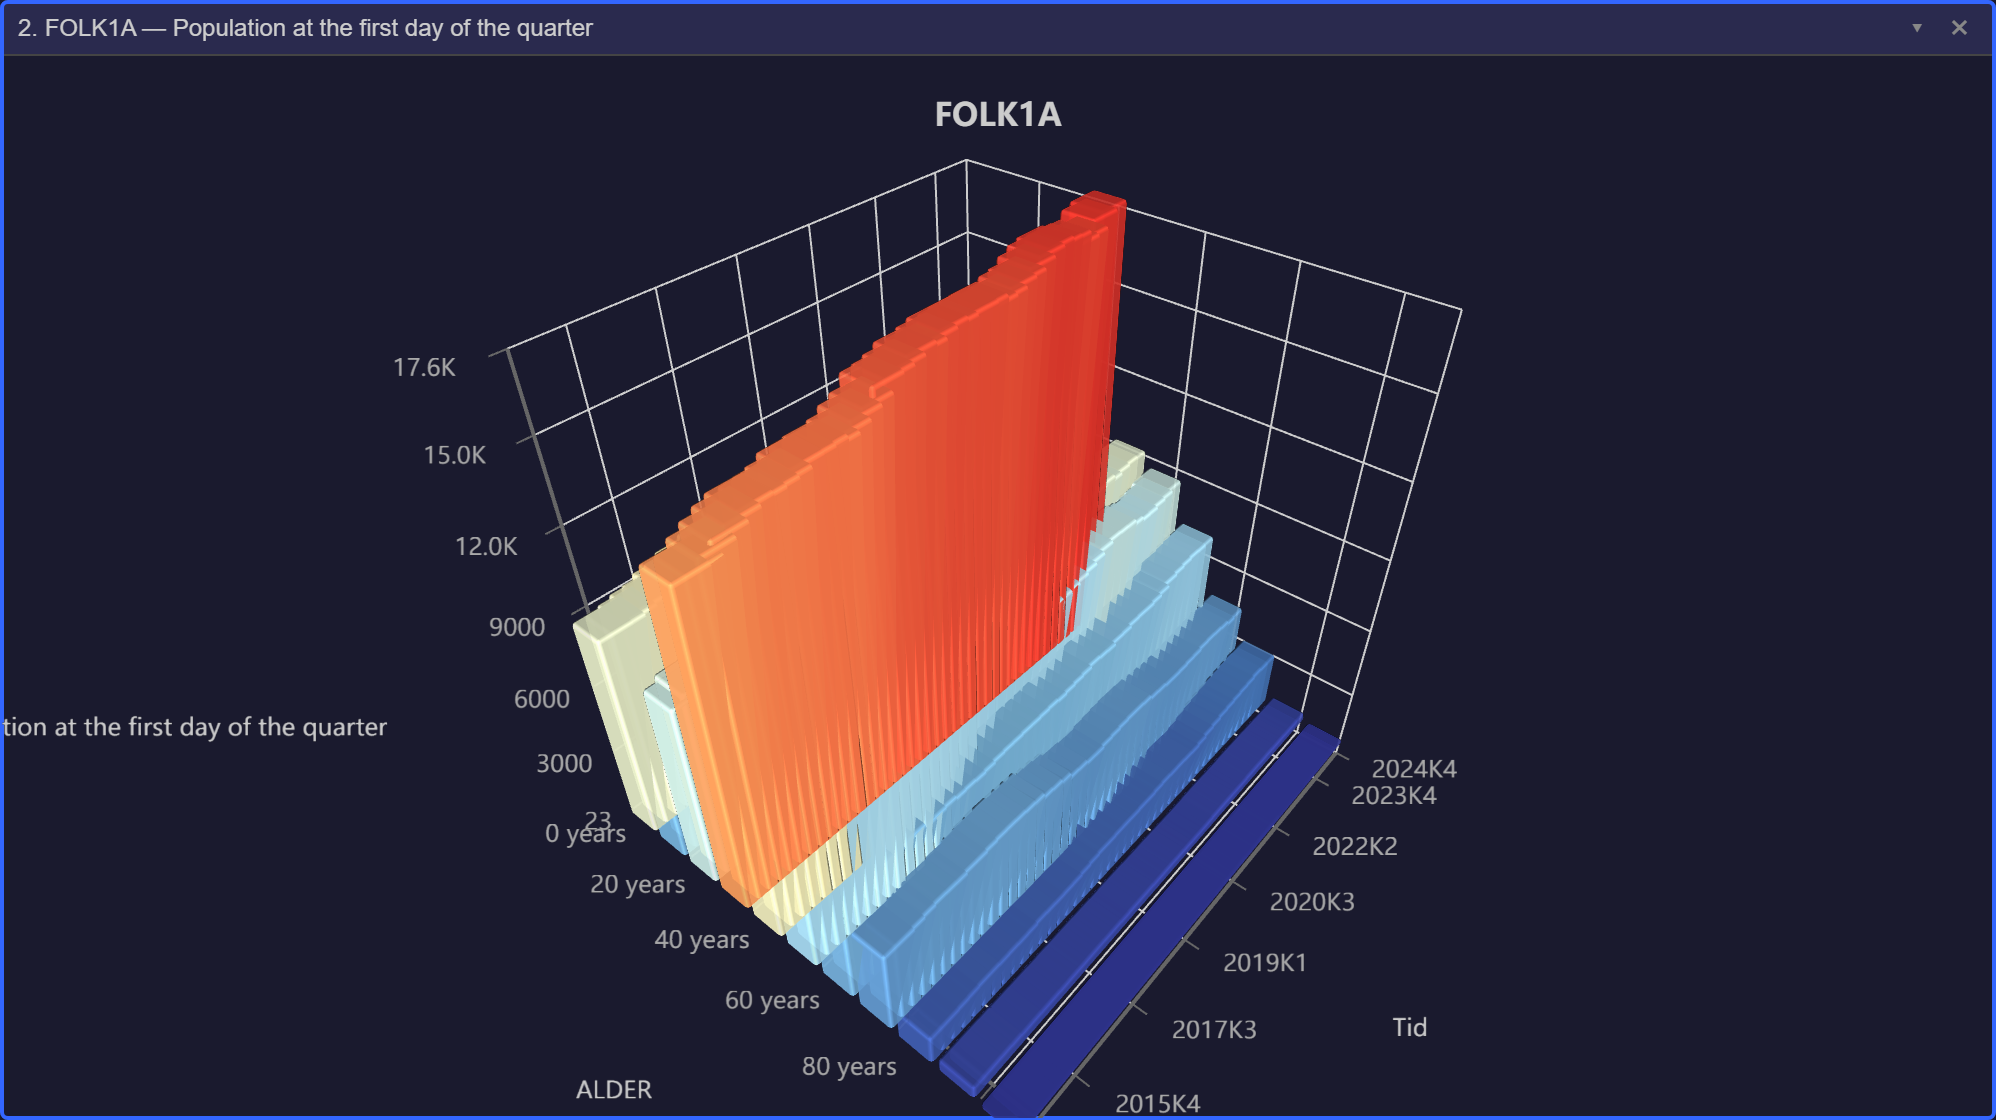
Interactive 2D and 3D charts in the browser, with multi-series merging and a built-in statistics panel.
Save and return
Save datasets and chart configurations by name, and pick up your analysis exactly where you left off.
Meet inside your data
Invite your team into a shared room: everyone sees the same datasets, charts and search results in real time, with spatial voice chat and avatars. Put on a VR headset and the same analysis becomes an immersive 3D workspace — WebXR runs straight from the browser on Quest-class headsets, no app-store install.
Private by architecture
Your table is never uploaded to the AI model. It stays on the server, and the assistant works through tools that read it and hand back a result — row counts, column types, an average. What does reach the model is your question, your column names, and the short list of repeating values in a grouping column; a preview you ask for adds a handful of real rows.
- The dataset stays server-side — the model gets summaries and a reference, never the table.
- Identifying columns keep their values — names, e-mail addresses and free text are counted, never quoted, to the model.
- Dedicated instances for organizations — your data on your own isolated server.
- Full audit trail — every data transformation is recorded and reversible.
Ready to explore?
Explore the demo or create an account and go from question to chart in minutes.